Graph View
Path view is not available for Step-by-Step Retrosynthesis analyses. ‘Graph View’ displays all results proposed for your target in one common graph.
In Graph View, molecules and reactions are represented by color-coded, round and diamond nodes, respectively. See the “Graph View Legend” section below for more details.
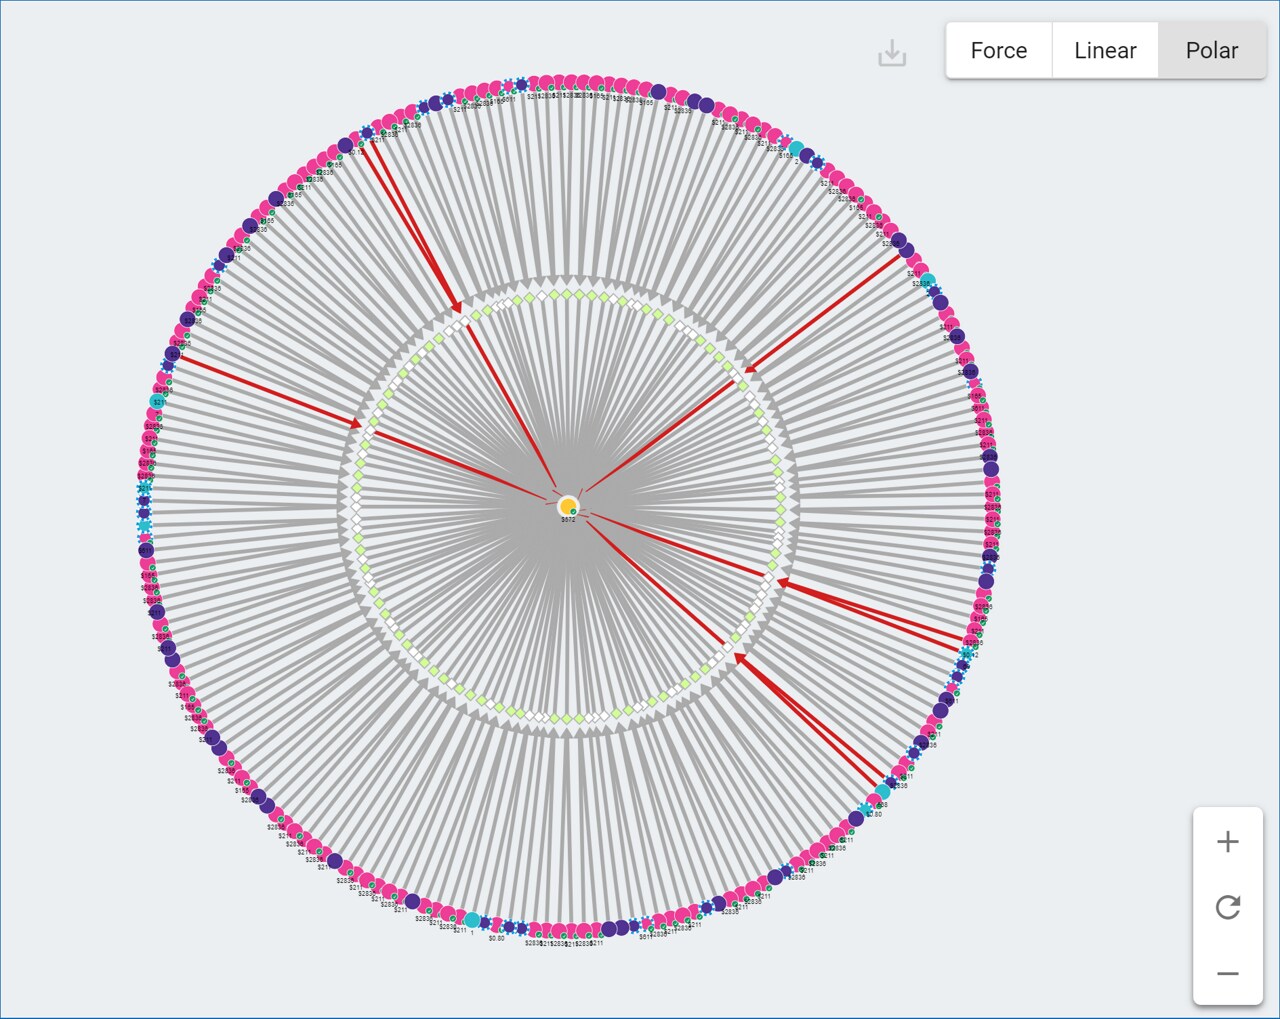
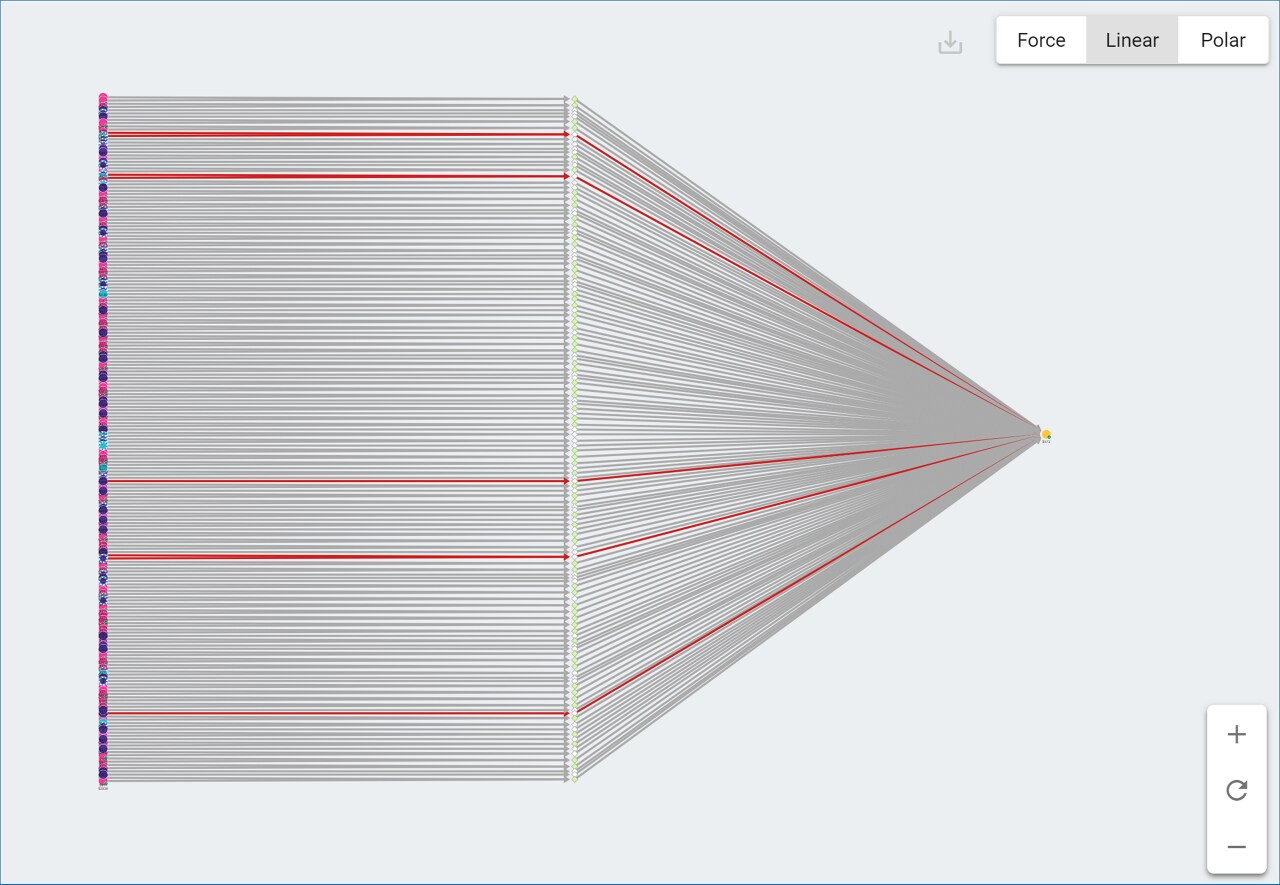
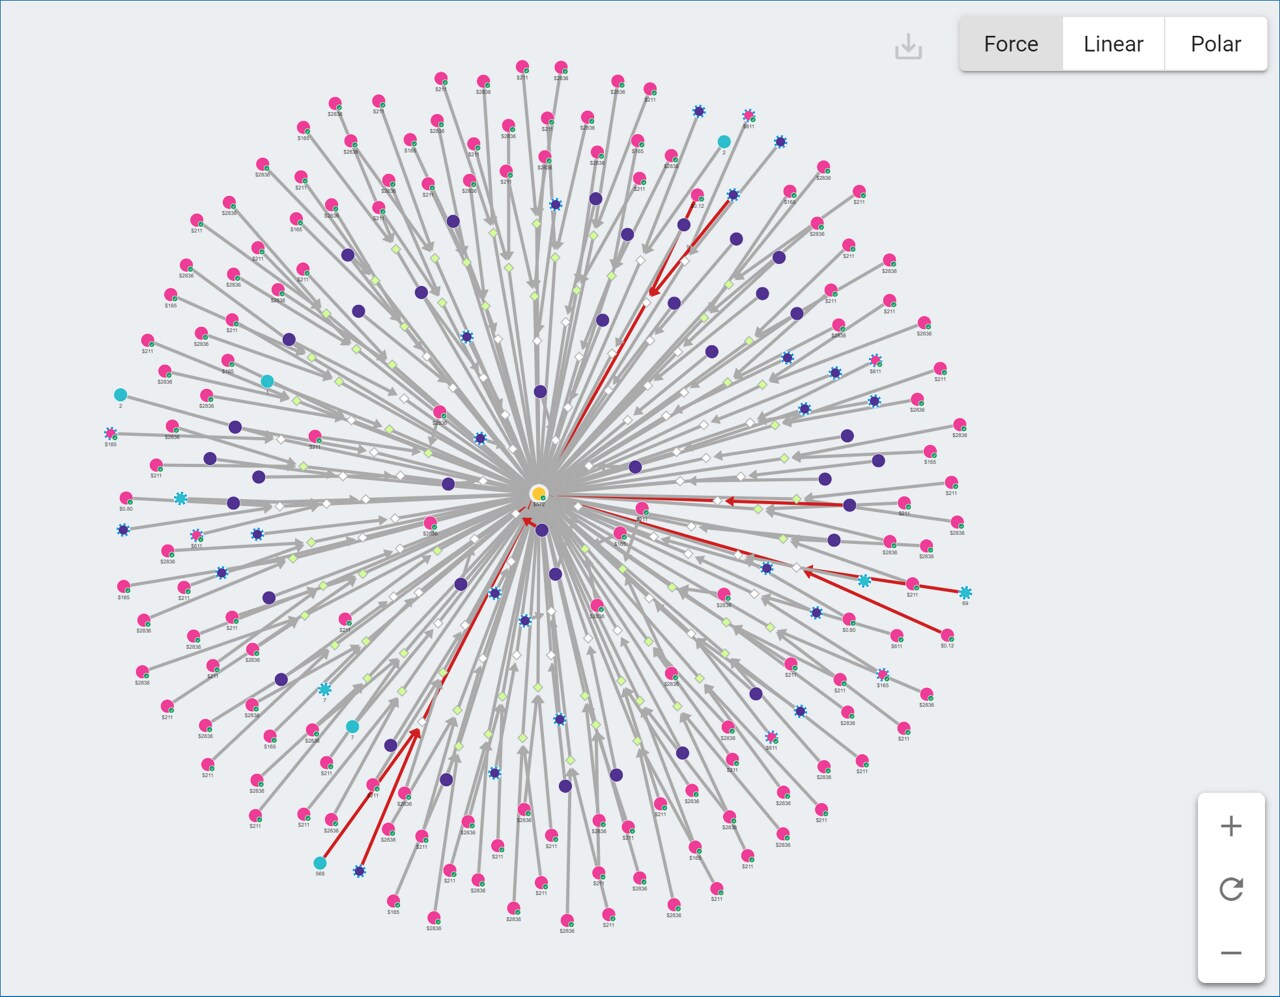
There are three distinct ways to view the graph of pathways: Force, Linear, and Polar.
Polar
Linear
Force
You can move the graph using your mouse to drag it in any direction. Zoom in and out using the controls at the lower right of the screen or your mouse wheel. Click the ‘Reset’ icon to return the view to center.
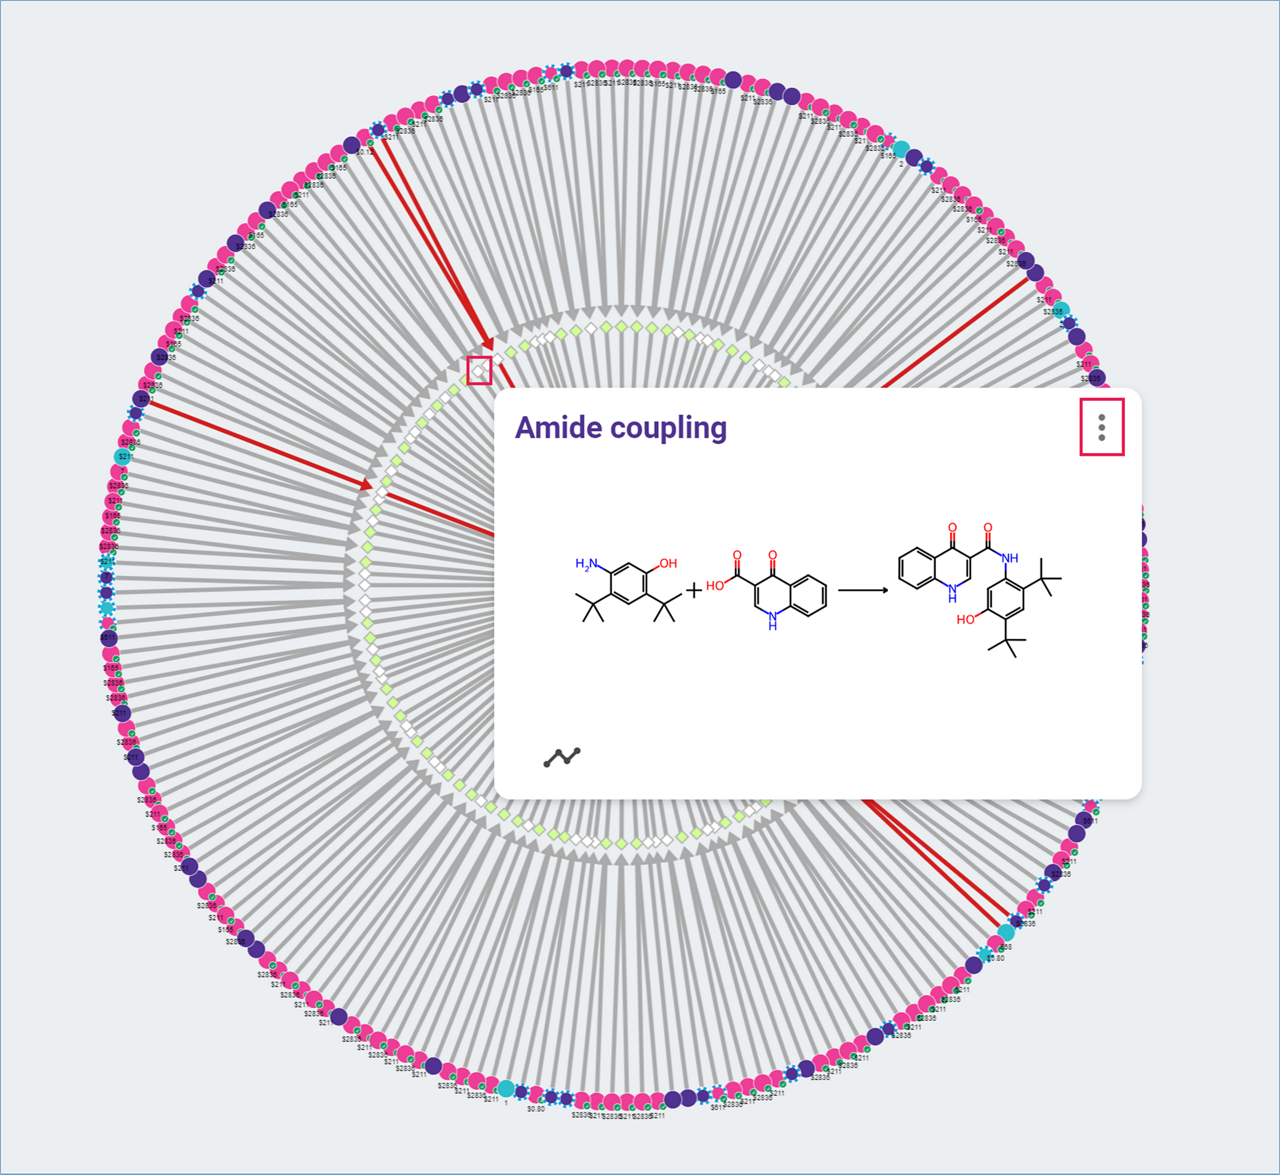
Hover over or click any molecule or reaction node to highlight the pathway it belongs to and open a pop-up window showing the molecule structure or reaction scheme, respectively. The pop-up window allows you to access the reaction or molecule card. (See “Molecule Cards” or “Reaction Cards” for more details.)
.png)

