.png)

Learning Center
Molecule Tiles View
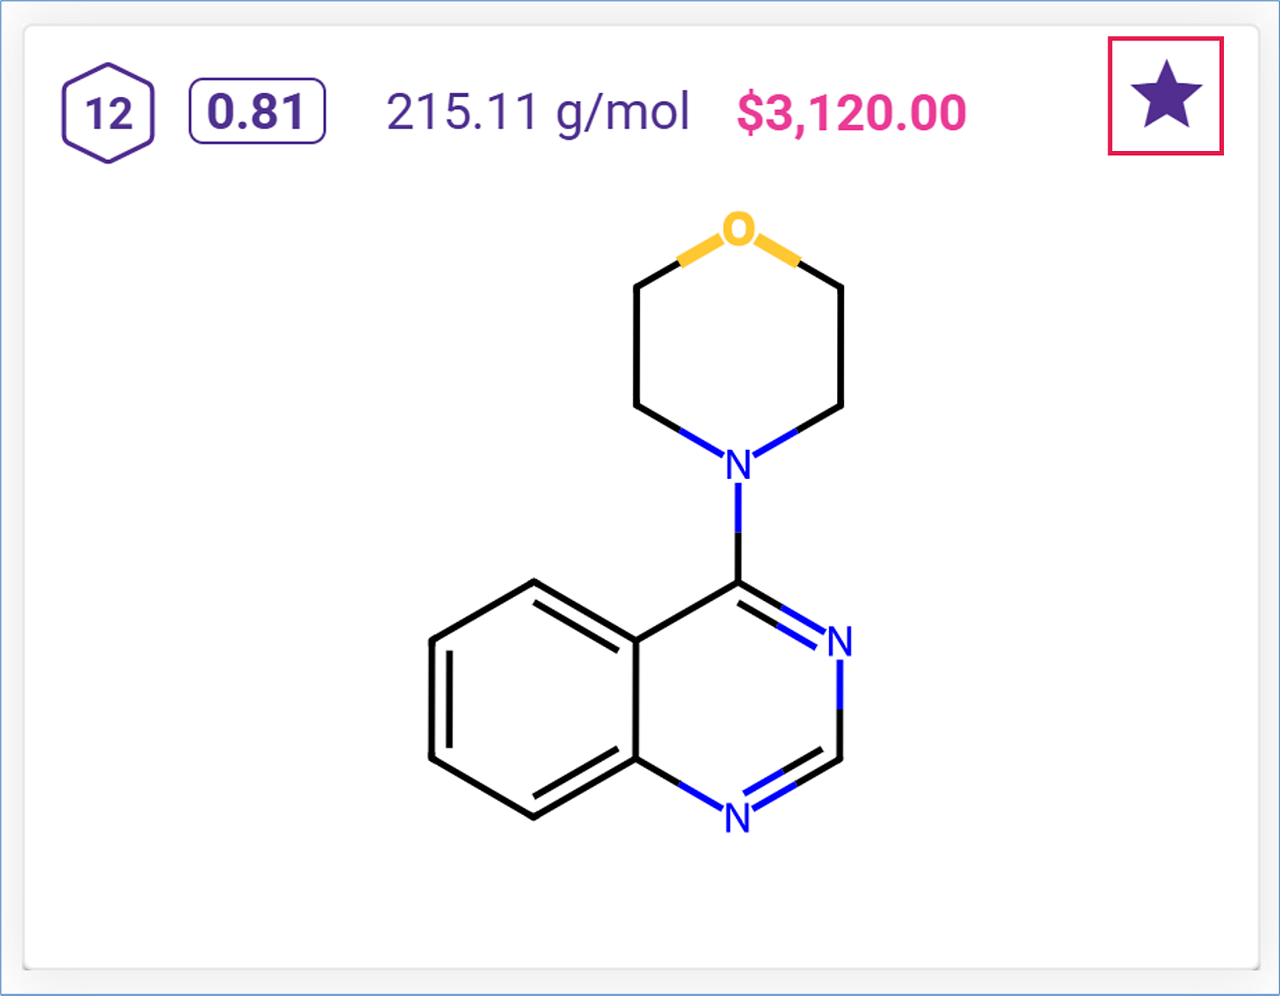
The results for a Diversity Library are presented as a list of molecules. Each molecule is represented as a tile displaying its structure. The first tile in the upper left corner of the screen is framed in blue and contains the initial parent molecule used to create the library. The other tiles each represent one of the target molecules proposed as part of the library.
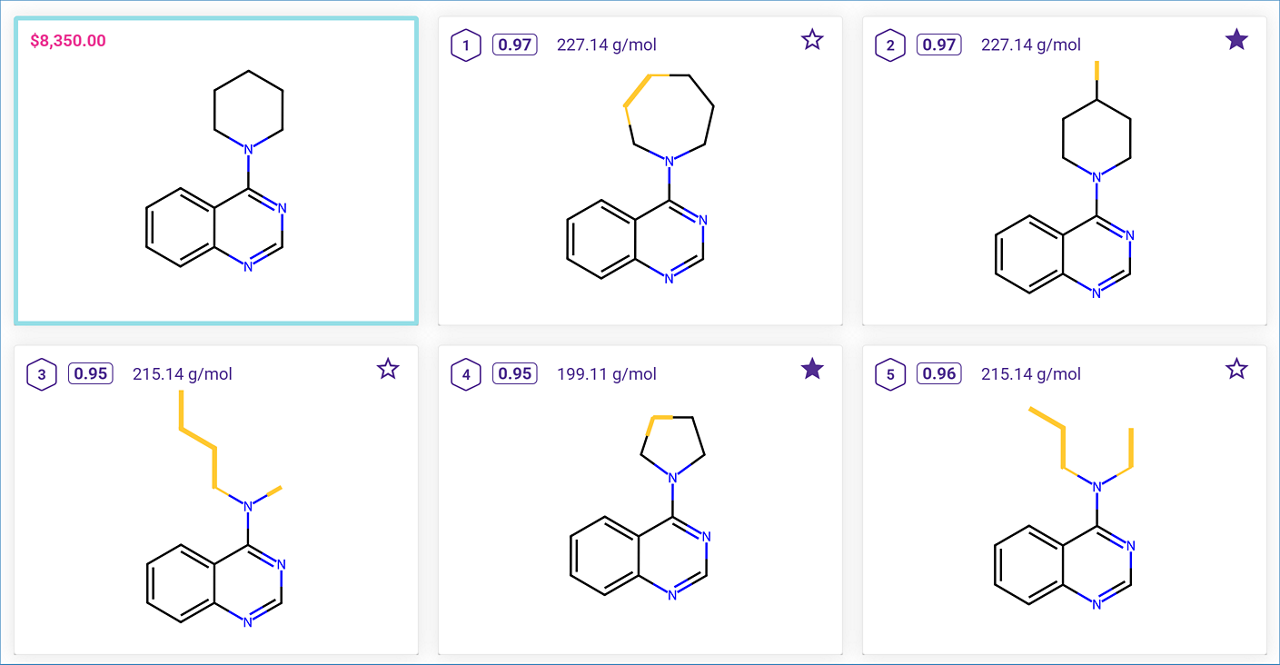
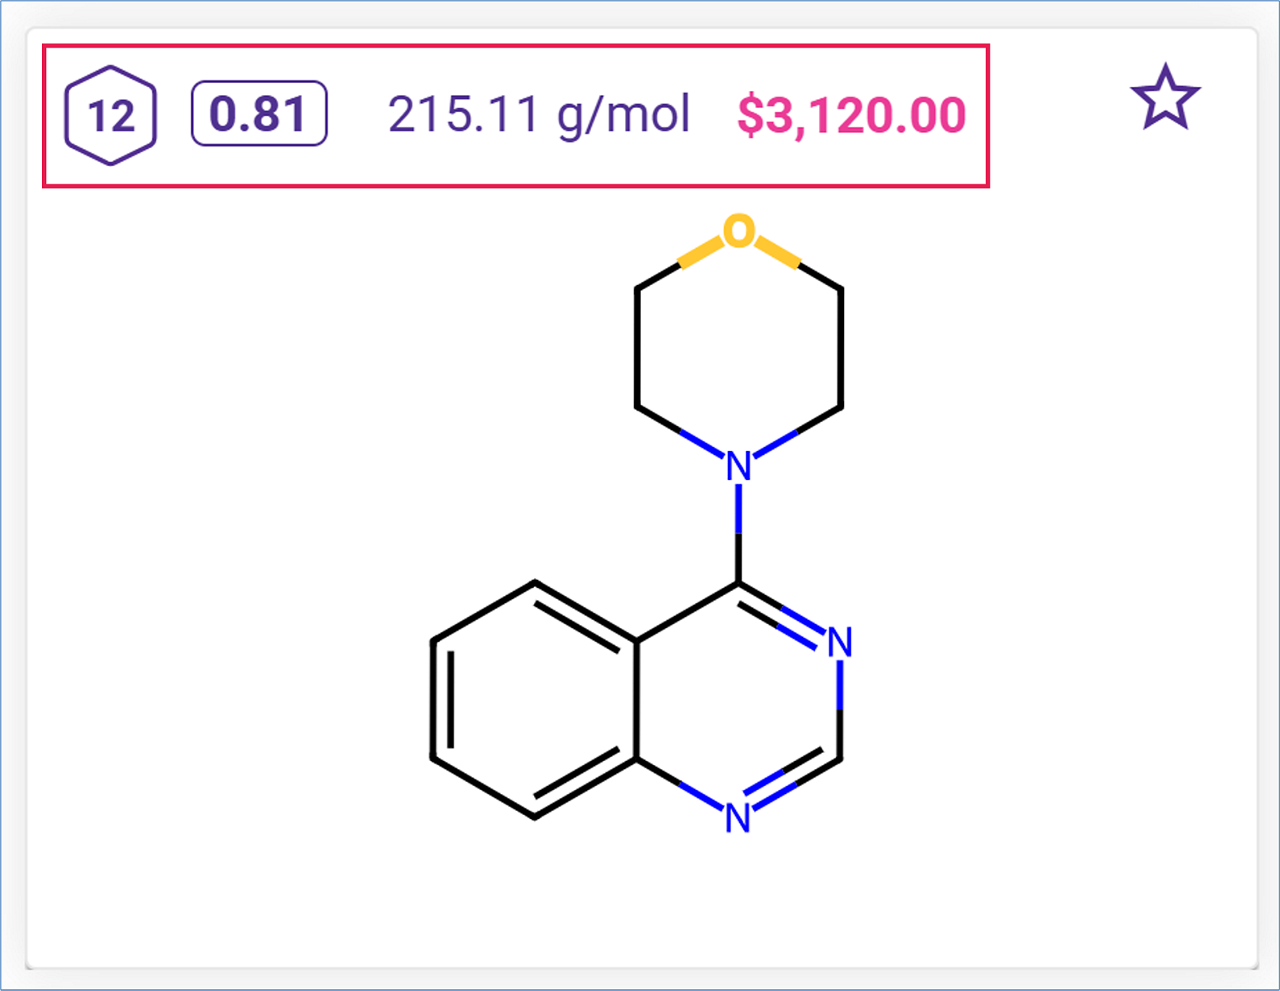
Each target molecule tile features a hexagon icon that displays its library number. The similarity to the parent molecule is calculated for each target molecule, with the similarity score shown next to the library number. The molecular weight of the compound is displayed next to the similarity score. For commercial compounds, the price in $/g is indicated next to the molecular weight.
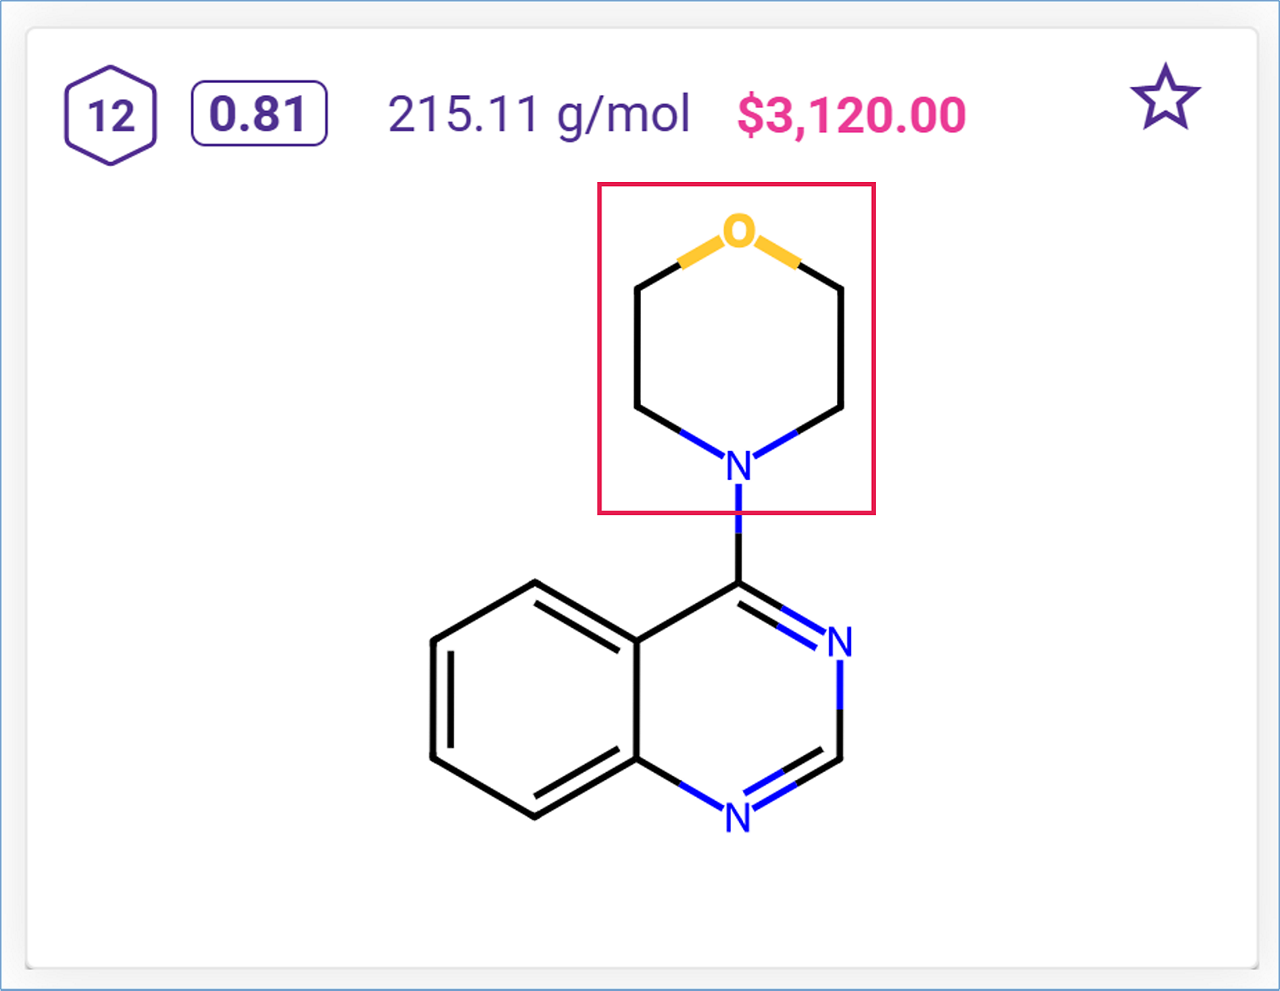
Structure differences of the target molecule relative to the parent molecule are highlighted in yellow.
Click the ‘Favorite’ icon on the upper right side of the card to include the molecule in your ‘Favorites’ list.