.png)

Learning Center
ANALYSIS TILES
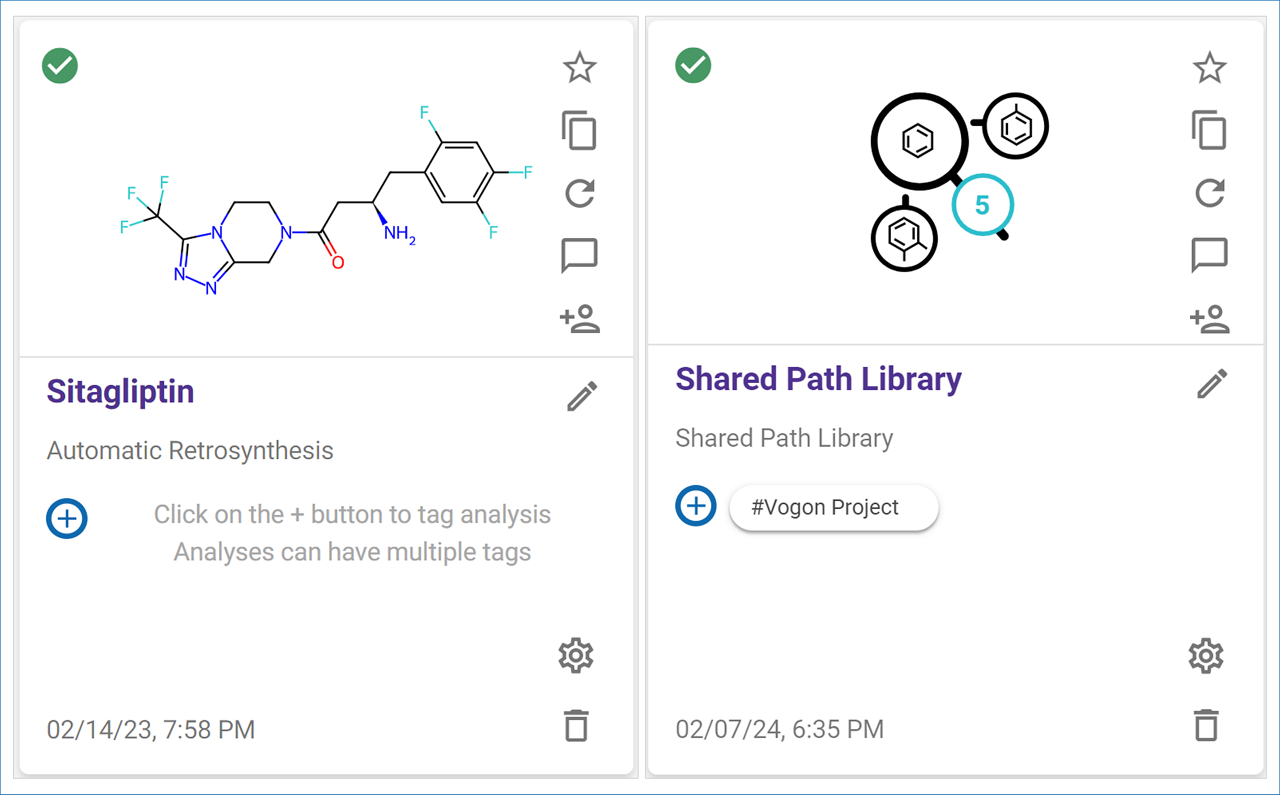
Each analysis is represented as a tile, which displays an image with the structure of your target molecule or the number of compounds in your library, the analysis name and type, added tags, and the date and time it was run.
You can see the structures from your library analyses by clicking on the eye next to the number in the image. This will open a popup window with a list of all the structures.
To access the analysis results, click on the analysis image or name to open the analysis results page.
Tip: Right-click on the analysis name to open the analysis in a new tab or window.